Centrifugal Filtration Technologies
Doing So Much More With Less
About the Product
What is CFT?
Centrifugal Filtration Technology or CFT is an attachment to existing diesel engine air intake filtration systems. These CFT systems are available as standard systems as well as custom designed systems. These systems are suitable for the typical high dust load situations encountered by large earth moving and agricultural machinery.
How does it work?
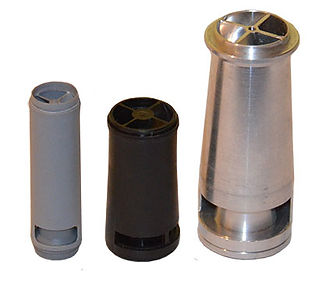
The pre-filter is an array of ultra high efficiency, high packing density vortex tubes stacked into an airtight chamber and fitted with an exhaust venturi scavenge system. The vortex tubes continuously remove the bulk of the intake dust down to micron size particles. The result is media filter-elements that last up to 9 times longer.
Benefits of CFT
-
Reduced dust load on the media filter.
-
Extended life of standard media filters.
-
Engine life improvement is achieved by reducing the silica content in the engine oil.
-
More efficient engine operation with less frequent media filter changes required.
-
Reduced Carbon footprint.
Case Study: Komatsu 860E Dump Truck
Introduction
An evaluation test was done on a Komatsu 860E Dump Truck to compare the efficiency of the vortex tube engine pre-filter against the standard pre-filter fitted by the factory. With the existing system the filters are changed every 1000 hours as longer service intervals could not be reached.
Test Procedure
Dump truck 559 – 4200 was equipped with the vortex tube pre-filters. Dump truck 559 – 4100 was used as the reverence for the test. New engine filters were installed in both trucks and the hours were logged. The filters were weighed on regular service intervals to determine the weight increase as the dust accumulate on the filters. This information was logged against the hours. To complete the test various pressure drops were taken under full load, to determine the differences between the tested filters.
Equipment used for testing
Scale: Supplied by Sishen Tribology Lab Alnor
Differential Meter: Supplied by JTVT Malvern Master-sizer: Third Party (To analyze dust particle size, accumulated on filter elements)
Method of testing
Each truck were equipped with new filters at the start of the test and the hours were recorded. The filter housings were marked with stickers to indicate that testing was in progress any only people involved in the test program can weigh or change filters. The start date for truck 42 was 29 November 2012. With standard service intervals the filters was weighed and put back into position. A separate plastic bag was used for each filter to ensure that the data was accurate for the duration of the test. On 25 June 2013, after 3851 hours of testing the pressure drops were measured for the final comparison. At this stage the filters was removed, sealed and sent to a third party to analyze the dust particles accumulated on the filters. The system pressure drop after 3851 hours was 3.44 kPa. The start date for truck 41 was 6 December 2012. The filters were weighed with a standard service interval after 1140 hours. The filters were replaced with new filters as the standard system had some failures in the past before the next service interval could be reached. To compare the system pressure drop with truck 42, the pressure was taken on 26 June 2013. After 648 hours the system pressure drop measured 2.26 kPa. The filters were also sent with the others to analyze the dust particles. Air Pre-Filter Comparison Test: Komatsu 860E
Test Results
Particle analyses for the dust accumulated on the filters are attached. A graph has also been drawn to show the difference between the operating hours and the dust accumulated on the filters. For comparison, the mass gained per hour was calculated for truck 41 during the 1140 hours before the filters were changed. This figure and the dust concentration for truck 42 was used to calculate values which was applied to see what would have happen if the test for truck 41 was also done with one set of filters.
Discussion of Results
The filters on truck 41 could not be tested past the approximately 1000 hours as turbo problems occur in the past when trying to reach longer service intervals before changing filters. The higher efficiency of the vortex pre-filter are visible in the comparison graph attached. The particle analyses confirm the theory of centrifugal filtration where the higher efficiency pre-filter will release finer particles to filters. (high centrifugal action – high efficiency – small through flow particle size) The pressure drop and efficiency curve for the TAS25 Vortex which is used on truck 42 is attached. The test was stopped at 3851 hours as enough data were taken over the seven months of testing to compile the report. It is clear from the results that much longer intervals can be reached before the filters are changed. The durability of the filters can also be confirmed on some other dump trucks operated on Sishen Mine. Komatsu 730E (nr. 515) was fitted with the vortex pre-filter and some tests were done. This pre-filters are still in operation on truck 515 and no spares were needed from new to now. The installation date was 21 May 1999.
Conclusion
The changes between filters can be increased from 1000 – 5000 hours without coming close to the OEM’s cut off pressure. Calculated pressure drop at 5000 hours will be approximately 4.2 kPa. This will result in a big saving on the replacement filters on the fleet of Komatsu 860E Dump Trucks.


Case Study: Kumatsu 860E test report for prototype AS18 Vortex Tube Filter System to filter the cooling air for the Main Alternator
Introduction
Dust particles passing through the alternator with the cooling air is causing a wear effect on some of the internal parts of the alternator. A filter system is required to capture the dust particles before entering the alternator. The filter must fit in the space available and the pressure drop (air flow restriction) across the filter must be as low as possible.
Prototype Filter System
The AS18 Vortex Tube Filter System was designed to fit into the space at the inlet of the main blower. The pressure drop across the filter was kept to the minimum but still achieving high centrifugal action through the vortex tubes. This is visible on the graph attached (Graph 1) The scavenge blower was designed to extract the filtered dust from the filter and blow it back into atmosphere. The drawing and photo’s attached show the general layout of the system and installation.
Test Equipment
-
Anemometer to measure velocity
-
Differential Pressure Gauge Meter
-
Temperature Meter
Test Preparations
Measuring points were discussed and 2 x holes Ø6 mm were drilled to ensure that all necessary points were measured. All holes were closed after the tests. The temperature was measured before each test to normalize the results for comparison purposes. The Graph is drawn at 0 DegC and sea level conditions (101.3kPa). The formula to compare results is as follows
?Pa.Va = ?Pn.Vn
ta tn
Test results measured
Airflow measurements were done before and after the fitting of the prototype filter system.
Before Fitting of prototype
Velocity was measured at the inlet grid of the main fan for the cooling air of the main alternator. This was done at 80Hz and 100Hz.
Velocity @ 80Hz (V1) = 11.8m/s
Velocity @ 100Hz (V2) = 15.5m/s
The design volume flow for the AS18 Vortex Tube Filter was calculated from these measurements. (Volume flow (Q) = Velocity (V) x Area (A))
Q1 = 3.02m3/s (6392 cfm)
Q2 = 3.96m3/s (8396 cfm)
After Fitting of Prototype
Airflow and pressure drop measurements were taken to compare with the measurements taken before installation. The airflow of the scavenge blower is also measured to ensure it is operating between 7 – 10 % of the main air flow.
Filter inlet Velocity (V3) @ 80Hz = 6m/s
Filter inlet Velocity (V4) @ 100Hz = 8m/s
Scavenge Blower outlet Velocity (V5) @ 80Hz = 17m/s
Scavenge Blower outlet Velocity (V6) @ 100Hz = 22.5m/s
Pressure Drop of Filter (?p1) @ 80Hz = 220Pa
Pressure Drop of Filter (?p2) @ 100Hz = 340Pa
To determine the flow through the AS18 Vortex Tube Filter a standard graph is used. (Graph 1) This graph shows information for a single vortex tube. The information from the graph is converted to site conditions and multiplied by the amount of tubes in the filter to calculate the actual volume flow after fitting the AS18 Vortex Tube Filter System.
Calculation Results
Q3 = 3.01m3/s (Q3 = Volume Flow @ 80Hz)
Q4 = 3.78m3/s (Q4 = Volume Flow @ 100Hz)
Q5 = 0.3m3/s (Q5 = Scavenge Blower Volume Flow @ 80Hz)
Q6 = 0.39m3/s (Q6 = Scavenge Blower Volume Flow @ 100Hz)
For a cross check of the volume flow, the filter inlet velocity (V3 &V4) is multiplied by the area and the open to close ratio of the inlet screen. This calculation shows the following:
-
Q3 (Calculated with V3) = 2.8 m3/s
-
Q4 (Calculated with V4) = 3.7 m3/s
Scavenge Blower is operating well and the percentages are as follows:
-
@ 80Hz – 10 % Scavenge Air
-
@ 100Hz – 10.3 % Scavenge Air 7.
Conclusion
The air flow through the main alternator has decrease from approximately 8396 cfm to 8006 cfm which reflect a loss of about 5% in air flow. This confirms that the AS18 Vortex Tube Filter System is operating according to our design where a pressure drop across the filter was estimated to be approximately 350Pa.